Weekly Market Update: S&P500, EURUSD & CRUDE OIL – Dec 9th, 2024
NOTE: This market newsletter is based on analysis conducted using the daily chart timeframe. Each market discussed is accompanied by a corresponding price chart for clarity and reference.
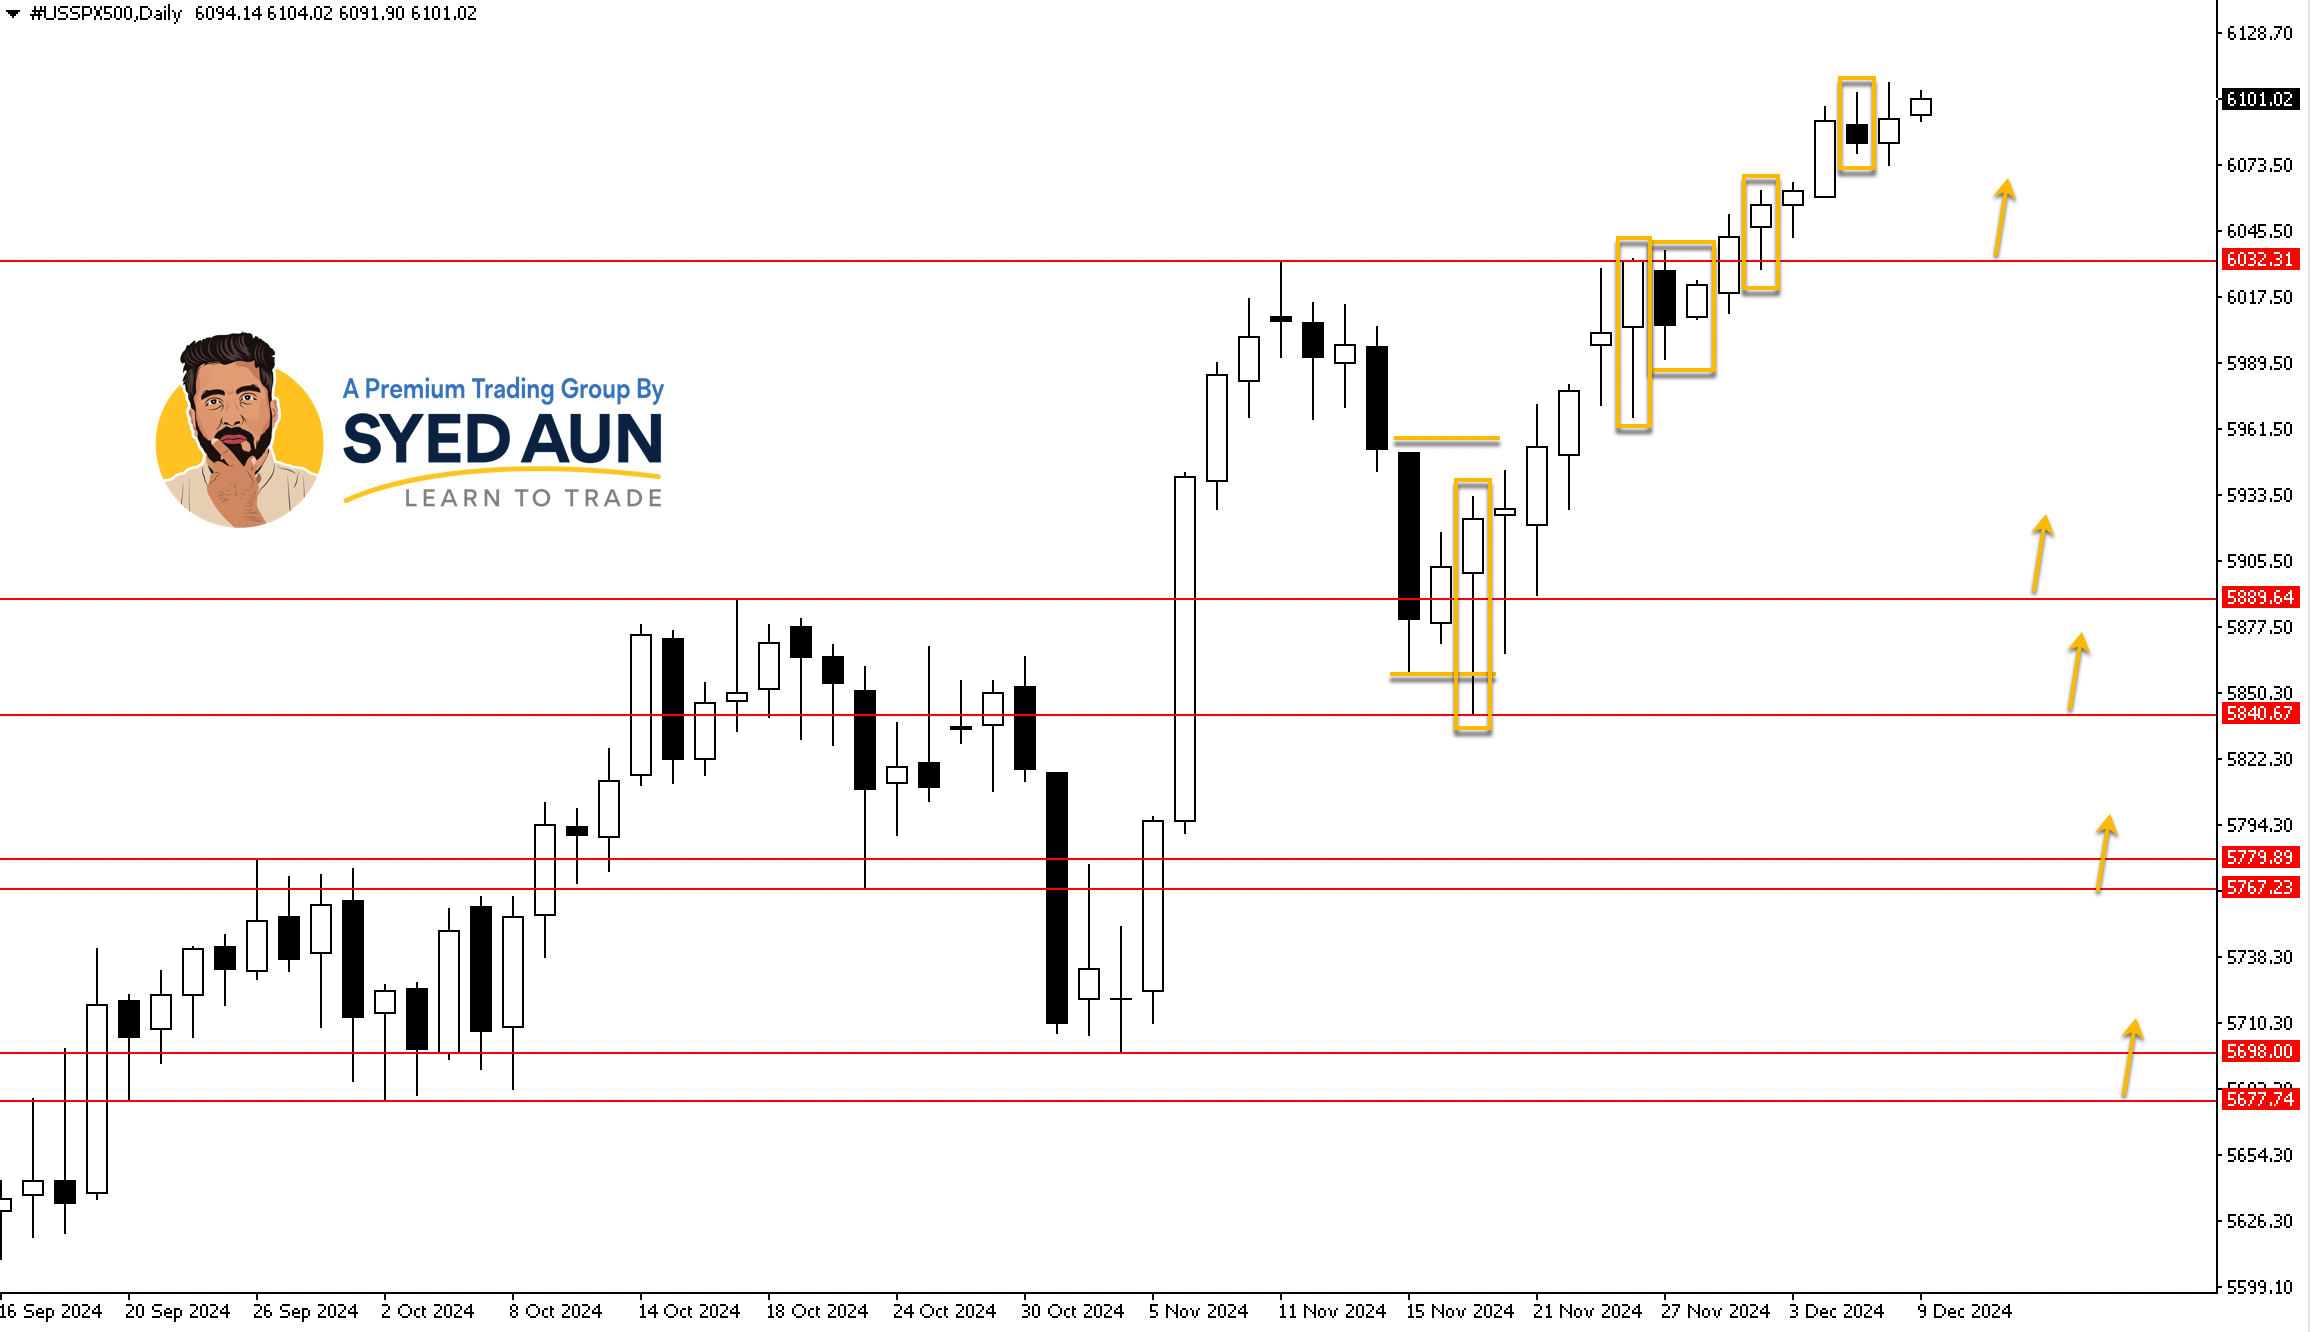
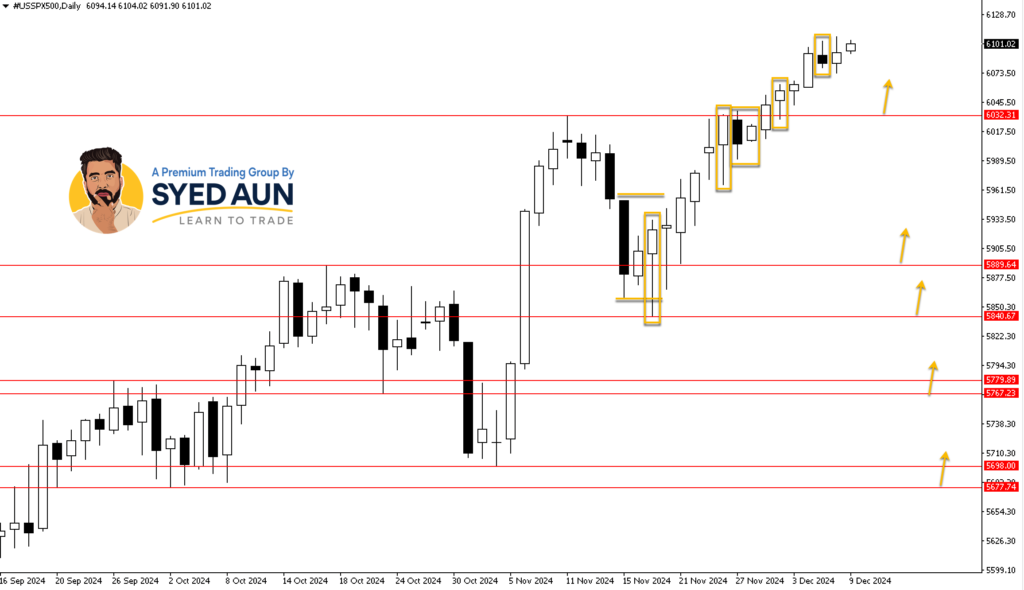
S&P500 – CASH: Buying On Retracement Lower To Within The Range Of Bullish Inside Bar Breakout
Comments: The Small Bearish Pin Bar Signal that had formed on Thursday, Dec 5th failed (We did not consider trading this signal nor did we mention it).
Price moved higher from the recent Inside Bar Pattern that had formed on Thursday, Nov 28th (We suggested buying on a breakout of this pattern in the Friday, Nov 29th daily market newsletter and hopefully some traders got on board).
Price moved higher from the prior Bullish Pin Bar Signal that had formed on Tuesday, Nov 26th (We suggested buying on a retracement lower into the range of this signal in the Nov 27th daily newsletter and hopefully some traders got on board).
Potential Trade Signal 1: We are looking to buy on a retracement lower to within the range of the recent Bullish Inside Bar Breakout that had triggered on Friday, Nov 29th.
Below is the actual signal posted in the Nov 29th daily market newsletter
Buy Stop: 6038 – This Trade is Active
Stop Loss: 5985
Take Profit: 6144
Potential Trade Signal 2: We are looking to buy on a retracement lower to within the range of the prior Bullish Pin Bar Signal that had formed on Tuesday, Nov 26th.
Below is the actual signal posted in the Nov 27th daily newsletter.
Buy Limit: 6000 – This Trade is Active
Stop Loss: 5950
Take Profit: 6150
To Trade This Market With Our Preferred Broker, CLICK HERE
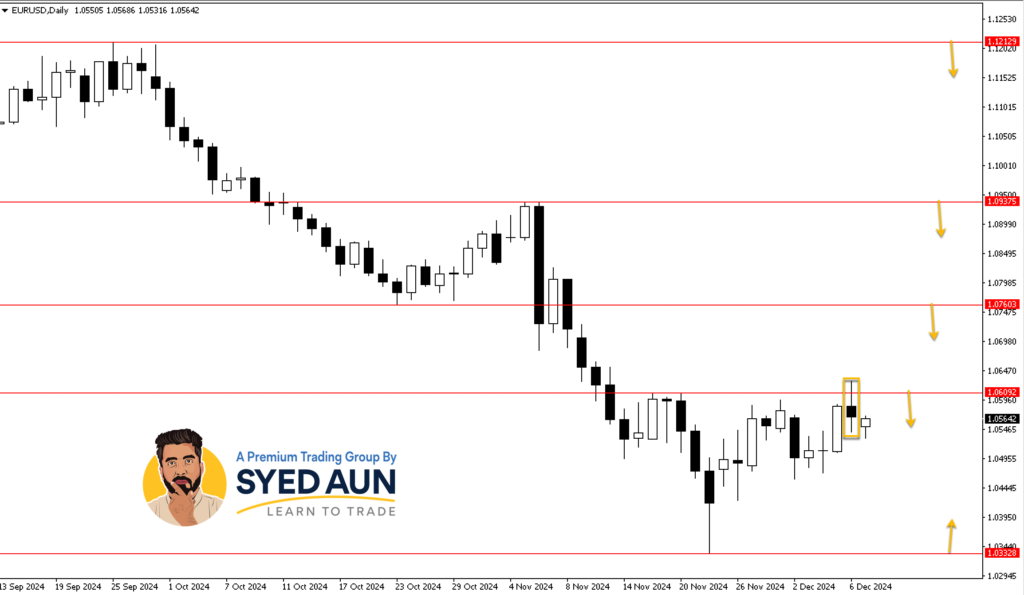
EURUSD: Selling On Retracement Higher To Within The Range Of Bearish Pin Bar Signal
Comments: Price formed a Bearish Pin Bar Signal just below the 1.0609 short-term resistance level on Friday, Dec 6th.
Potential Trade Signal: We are looking to sell on a retracement higher to within the range of the current Bearish Pin Bar Signal that had formed on Dec 6th.
Sell Limit: 1.0585
Stop Loss: 1.0649
Take Profit: 1.0457
To Trade This Market With Our Preferred Broker, CLICK HERE
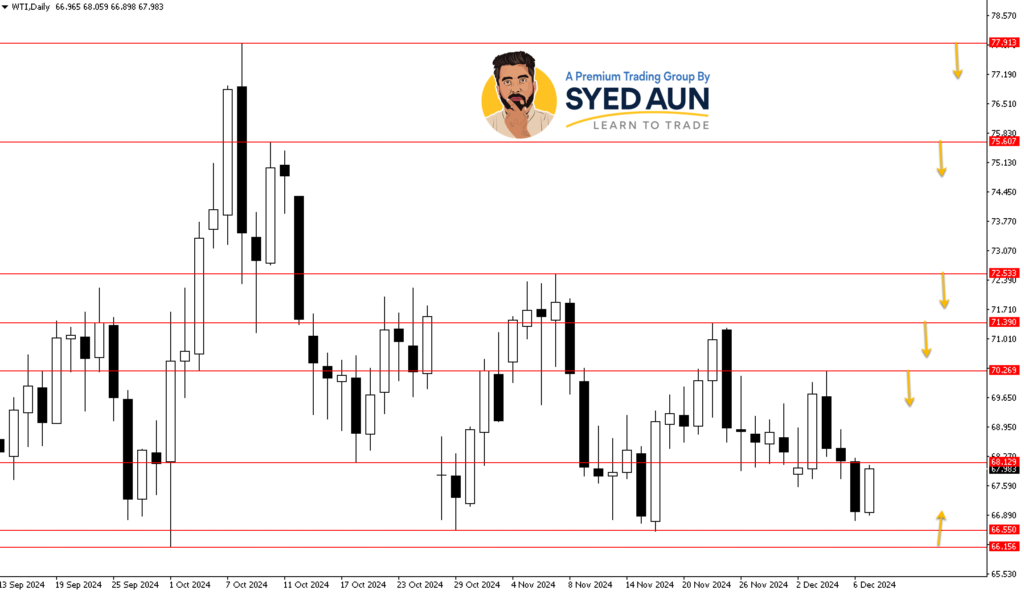
CRUDE OI – WTI: Buying On Retracement Lower & After Price Action Signal At Or Above $70.26 – $71.39 Support Area
Comments: Price is trading just above the $66.15 – $66.55 short-term support area as of this writing.
Potential Trade Signal 1: We are looking to buy on a retracement lower and after a price action buy signal, at or just above the $66.15 – $66.55 short-term support area.
Potential Trade Signal 2: We are looking to sell on a deeper retracement higher and after a price action sell signal, at or within the $70.26 – $71.39 short-term resistance area.
To Trade This Market With Our Preferred Broker, CLICK HERE
We will love to hear your Feedback!
To get access to our Premium Discord & Facebook Groups and get daily updates on 20+ markets – CLICK HERE
Disclaimer: The risk of loss in trading financial market products, like Cryptocurrencies can be substantial. You should therefore carefully consider whether such trading is suitable for you in light of your financial condition. Any content posted here should not be considered financial or Trading advice, this newsletter is just for information purposes and is just the author’s opinion.

